
Related Manuals for ATS 540


Summary of Contents for ATS 540
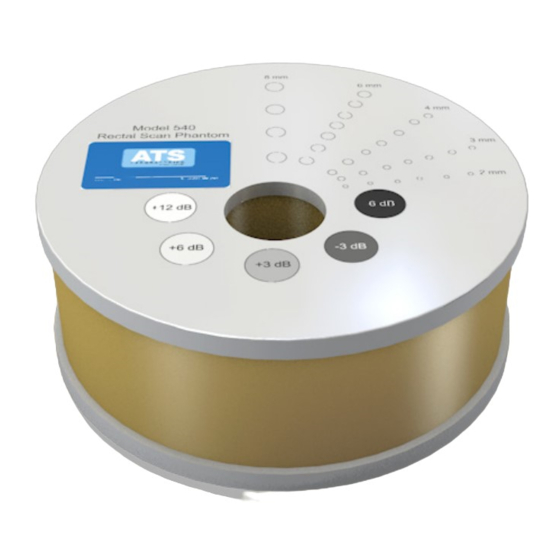
- Page 1 MODEL 540 RECTAL SCAN PHANTOM Revised 2013 ATS Laboratories, Incorporated 900 Asbury Ave Norfolk, VA USA Tel: 1-800- 617-1177 Fax: 1-757- 857-0523 [email protected] Email: Website: www.atslaboratories-phantoms.com...
-
Page 2: Product Description
Most diagnostic imaging systems are calibrated for a sound velocity of 1,540 meters per second (mps), which is the assumed average velocity of sound through human soft tissue. The rubber-based tissue-mimicking material has a sound velocity of 1450 and 1473 mps at 0.5db/cm/Mhz and 0.7db/cm/Mhz respectively at room temperature... - Page 3 SPECIFICATIONS GENERAL Overall Diameter: 18.2 cm* Height: 8.4 cm* Weight: 1.6 Kg* Housing Material: Polyethylene Scanning Well: Scan Well Diameter: 3.5 cm (Tapered)* TISSUE MIMICKING MATERIAL Type: Urethane Rubber Freezing Point: < -40° C Melting Point: > 100° C 0.5 db/cm/Mhz (measured at 3.5 MHz) Attenuation Coefficient**: Speed of Sound: 1450 m/s at 23°C...
- Page 4 Target Diagram FOCAL ZONE Description and Reason For Testing The focal zone is the region surrounding the focal point in which the intensity and the lateral resolution is the greatest. Clinically, structures examined within the focal zone will provide the best diagnostic information obtainable. The focal zone can be affected by changes in the pulsing/receiving section of the imaging system or damage to the transducer.
- Page 5 settings on the quality assurance record. These setting should be used for subsequent testing. 5. Move the transducer slightly until the smallest anechoic group of targets is clearly displayed. Freeze the display and obtain a hard copy. 6. Examine the group of targets displayed, to determine which target is the most clearly displayed as compared to the adjacent targets.
- Page 6 5. Note: The test should also be performed with the output set at extreme high and low values, in addition to the values given above. This enables any changes in output to be more easily detected. 6. Move the transducer slightly until the smallest group of anechoic targets are clearly displayed.
- Page 7 5. Move the transducer slightly until the anechoic circular targets are clearly imaged. 6. Freeze image and obtain a hard copy. 7. Examine the image to determine the first and last target in each size group displayed. Record the range of depths visualized for each group. Due to the configuration of the sound beam small targets in the near field may not be imaged.
- Page 8 5. Move the transducer slightly until the gray scale target group is clearly imaged. 6. Freeze image and obtain a hard copy. 7. Examine the image. The targets should appear circular in shape, with clear sharp edges and vary in the degree of brightness ranging from low to high levels of contrast. The presence or absence of any shadowing behind the structures should be noted.
- Page 9 The Doppler Flow Phantoms have been exposed to pressures in excess of 15 PSI or 1.05 Kg/cm². ATS shall not be otherwise liable for any damages, including but not limited to incidental damages, consequential damages, or special damages. There are no express or implied warranties which extend beyond the warranties as stated above.