Table of Contents
Quick Links
Table of Contents

Related Manuals for Siemens A80672


Summary of Contents for Siemens A80672
- Page 1 INSTALLATION & OPERATION A80672 PTC CONSOLE FEBRUARY 2021 DOCUMENT NO. SIG-00-13-12 VERSION B Siemens Mobility, Inc. 700 East Waterfront Drive Munhall, Pennsylvania 15120 1-800-793-SAFE www.usa.siemens.com/rail-manuals Copyright © 2014 - 2019 Siemens Mobility, Inc All rights reserved...
-
Page 2: Proprietary Information
Any person or entity that relies on translated information does so at his or her own risk. WARRANTY INFORMATION Siemens Mobility, Inc. warranty policy is as stated in the current Terms and Conditions of Sale document. Warranty adjustments will not be allowed for products or components which have been subjected to abuse, alteration, improper handling or installation, or which have not been operated in accordance with Seller's instructions. - Page 3 3-28-14 - - - - - INITIAL RELEASE 11-12-2018 4.1.2.2 Updated with PTC General Parameters and updated branding to Siemens Mobility, Inc. 10-09-2019 All, Updated WebUI Screenshots and added Appendix A. Appendix A 02-15-2021 Page 1-3, Section 1.2: Caution added to ECD description and Figure 1.3 added.
-
Page 4: Table Of Contents
Table of Contents Section Title Page PROPRIETARY INFORMATION ....................ii TRANSLATIONS .......................... ii WARRANTY INFORMATION ....................... ii SALES AND SERVICE LOCATIONS ................... ii FCC RULES COMPLIANCE ......................ii DOCUMENT HISTORY ........................ ii NOTES, CAUTIONS, AND WARNINGS ..................x ELECTROSTATIC DISCHARGE (ESD) PRECAUTIONS ............xi SECTION 1 .......................... - Page 5 4.1.2 Configuration Menu ......................4-3 4.1.3 Report and Logs ......................... 4-28 4.1.4 Status Monitor ........................4-48 4.1.5 Maintenance ........................4-65 4.1.6 Diagnostics ......................... 4-72 SECTION 5 ..........................4-1 Maintenance ........................5-1 General ............................5-1 On-Site Personnel ........................5-1 5.2.1 On-Site Personnel Operation ....................5-1 5.2.2 Remote User Access Authentication ..................
- Page 6 LIST OF FIGURES Section Title Page Figure 1-1 PTC Console .......................... 1-1 Figure 1-2 PTC Console Indicator and Controls Locations ..............1-3 Figure 1-3 ECD Flashing Red to indicate it is actively writing data ............1-4 Figure 1-4 A26702-0X MultiPort Cable ....................1-6 Figure 1-5 A26702-0X MultiPort Cable Wiring Diagram ................
- Page 7 Figure 4-22 Console Configuration Menu ....................4-15 Figure 4-23 Configuration Serial Ports ....................4-15 Figure 4-24 Serial Port Configuration Options ..................4-16 Figure 4-25 Serial Port Protocol Configuration ..................4-16 Figure 4-26 Console Configuration - Ethernet Ports ................4-17 Figure 4-27 Ethernet Port Configuration - DNS ..................4-18 Figure 4-28 Console Configuration –...
- Page 8 Figure 4-66 View or Download CDL Log ....................4-45 Figure 4-67 CDL Log Printout ........................ 4-46 Figure 4-68 Removing a CDL File ......................4-47 Figure 4-69 CDL File Removal Confirmation ..................4-47 Figure 4-70 Status Monitor Menus ......................4-48 Figure 4-71 Status Monitor - PTC Status ....................4-48 Figure 4-72 Status Monitor - System State View ...................
- Page 9 Figure 4-110 RC2 Key Software Upgrade ..................... 4-70 Figure 4-111 Site Configuration Software Upgrade ................4-70 Figure 4-112 Download Configuration and Application Files ..............4-70 Figure 4-113 Vital Configuration Download ................... 4-71 Figure 4-114 Vital Application Download ....................4-71 Figure 4-115 Non-Vital Configuration Download ................... 4-71 Figure 4-116 Non-Vital Application ......................
-
Page 10: Notes, Cautions, And Warnings
EQUIPMENT. CAUTIONS TAKE PRECEDENCE OVER NOTES AND ALL OTHER INFORMATION, EXCEPT WARNINGS. NOTE Generally used to highlight certain information relating to the topic under discussion. If there are any questions, contact Siemens Mobility, Inc. Application Engineering. SIG-00-13-12 February 2021 Version No.: B... -
Page 11: Electrostatic Discharge (Esd) Precautions
(ESD) during the handling, shipping, and storage of electronic modules and components. Siemens has instituted these practices at its manufacturing facility and encourages its customers to adopt them as well to lessen the likelihood of equipment damage in the field due to ESD. - Page 12 This Page Intentionally Left Blank SIG-00-13-12 February 2021 Version No.: B...
-
Page 13: Section 1
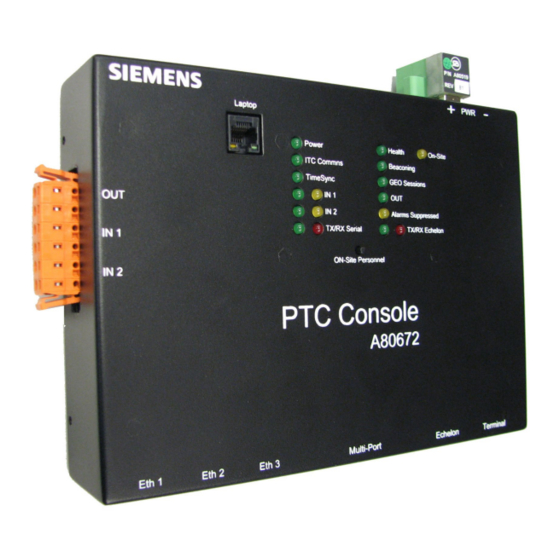
INTRODUCTION _______________________________________________________________________________________________________________ SECTION 1 INTRODUCTION 1.0 INTRODUCTION GENERAL DESCRIPTION The PTC Console is an interface component of the wayside PTC system that can be configured for a variety of applications for wayside control and monitoring, including Positive Train Control (PTC) applications. PTC CONSOLE The PTC Console is shown in Figure 1-1. -
Page 14: Ptc Console Indicators And Controls
INTRODUCTION _______________________________________________________________________________________________________________ 1.2.1 PTC Console Indicators and Controls See locations on the following page. Laptop Port Power/ECD Connector I/O Port - VRO x1/VPI x2 Power Indicator ITC Comms (Communications) Time Sync IN 1 (VPI on I/O Connector) IN 2 (VPI on I/O Connector) TX/RX Serial Port On-Site (Illuminates when On-Site Personnel Button is pressed) Health Status... -
Page 15: Figure 1-2 Ptc Console Indicator And Controls Locations
INTRODUCTION _______________________________________________________________________________________________________________ Figure 1-2 PTC Console Indicator and Controls Locations CAUTION WHEN INSTALLING THE POWER/ECD CONNECTOR AS SHOWN AT LOCATION (2) IN FIGURE 1-2, ENSURE THE TWO SCREWS LOCATED ON EITHER SIDE OF THE POWER CONNECTOR ARE SECURELY FASTENED, TO PREVENT LOOSENING OF THE DEVICE. ADDITIONALLY, DO NOT UNPLUG THE ECD WHEN ACTIVELY FLASHING RED (SHOWN IN FIGURE 1-3). -
Page 16: Figure 1-3 Ecd Flashing Red To Indicate It Is Actively Writing Data
INTRODUCTION _______________________________________________________________________________________________________________ Figure 1-3 ECD Flashing Red to indicate it is actively writing data Table 1-1 Indicator Information Indicator LED Color LED State Description and Function Power is applied to the unit Power Green Power is not applied to the unit or the internal power supply has failed Flashing System is healthy... - Page 17 INTRODUCTION _______________________________________________________________________________________________________________ All connected GEO systems are in session Green Flashing At least one GEO is in session but not all Session All GEOs are out of session Green On Input is energized positive Yellow Off Green IN1 & IN2 Yellow On Yellow Input is energized negative...
-
Page 18: A26702-0X Ptc Console Multiport Cables
INTRODUCTION _______________________________________________________________________________________________________________ A26702-0X PTC CONSOLE MULTIPORT CABLES The PTC Console has two MultiPort Cables as detailed in the following sections. 1.3.1 A26702-0X PTC Console MultiPort Cable The PTC Console A26702-0X Multi-Port cable provides three serial ports for external devices. Figure 1-4 shows the PTC Console Multi-Port Cable. -
Page 19: Figure 1-5 A26702-0X Multiport Cable Wiring Diagram
INTRODUCTION _______________________________________________________________________________________________________________ TO PTC CONSOLE VIOLET DARK BLUE DB-9 VIOLET RS 232 DARK BLUE DB-9 VIOLET RS 232 DARK BLUE DB-9 WHT/ORG R2, 121Ω 1/2 W, 1% WHT/BLUE R2, 121Ω 1/2 W, 1% WHT/BRN R2, 121Ω 1/2 W, 1% R2, 121Ω 1/2 W, 1% WHT/GRN 12-PIN... -
Page 20: A26775-0X Ptc Console Multiport Cable
INTRODUCTION _______________________________________________________________________________________________________________ 1.3.2 A26775-0X PTC Console MultiPort Cable The PTC Console A26775-0X Multi-Port cable provides a serial port for external devices. Figure 1-6 shows the PTC Console Multi-Port Cable. This is used to connect a PTC-enabling GEO with CPU1, which does not support an Echelon connection to the PTC Console. -
Page 21: Ordering Information
INTRODUCTION _______________________________________________________________________________________________________________ ORDERING INFORMATION Figure 1-8 displays the PTC Console and Multi-Port Cable ordering information. Options are subject to change. Contact Siemens Mobility, Inc. Customer Service for the latest configuration options. PTC Console: 8000-80672-00XX W/O MOUNTING PLATE MOUNTING PLATE SOFTWARE... -
Page 22: Specifications
INTRODUCTION _______________________________________________________________________________________________________________ 1.4.1 Specifications Power Requirements Input Voltage 9-32 VDC, Isolated, Reverse Polarity Protection Input Current 1.1 Amps Max @ 13.8 VDC Connectivity Power 2-Pin Phoenix Ethernet Ports RJ-45 Echelon® 4-Pin Wago ® MultiPort DB-44 Vital I/O Port 6-Pin Wago ®... - Page 23 INTRODUCTION _______________________________________________________________________________________________________________ This Page Intentionally Left Blank 1-11 SIG-00-13-12 February 2021 Version No.: B...
-
Page 25: Section 2
APPLICATIONS _______________________________________________________________________________________________________________ SECTION 2 APPLICATIONS 2.0 APPLICATIONS APPLICATIONS OVERVIEW The PTC Console may be used in a variety of applications. This section will provide an overview of possible applications using the PTC Console. 2.1.1 PTC Enabled GEO In this example, the SEAR II remains in place to perform the non-vital logic and codeline interface functions. The PTC Console is installed into an existing system to report signal/switch/hazard detector status to the PTC network. -
Page 26: Dark Territory
Figure 2-2 shows an example of a Dark Territory installation with monitor and control of a switch via radio. Switch t ll PTC Console Radio DATA R di Figure 2-2 Dark Territory Installation Example NOTE For other application of the PTC Console, contact Siemens Mobility Inc. SIG-00-13-12 February 2021 Version No.: B... -
Page 27: Section 3
INSTALLATION AND CONFIGURATION _______________________________________________________________________________________________________________ SECTION 3 INSTALLATION AND CONFIGURATION 3.0 INSTALLATION AND CONFIGURATION INSTALLATION OVERVIEW Figure 3-1 displays all the possible connections to the PTC Console. Battery 9–32 VDC VRO + VRO - VPI Channel 1 + VPI Channel 1 - VPI Channel 2 + VPI Channel 2 - Vital... -
Page 28: Example Ptc Enabled Geo Installation
INSTALLATION AND CONFIGURATION _______________________________________________________________________________________________________________ 3.1.1 Example PTC Enabled GEO Installation The figure below is an example of a PTC Enabled GEO installation. PTC Enabled GEO ATCS RADIO PTC RADIO DC-DC Universal Local Control Panel 25 Amp (ULCP) PTC Console ATCS Isolated Radio DATA... -
Page 29: Figure 3-3 Ptc Enabled Geo Wiring Diagram
INSTALLATION AND CONFIGURATION _______________________________________________________________________________________________________________ 3.1.1.1 PTC Enabled GEO Wiring Diagram The figure below depicts an example wiring diagram of a PTC Enabled GEO installation. Echelon® ULCP ATCS RADIO RADIO Console CARD Ethernet 10/100 Echelon® COMMUNICATIONS MANAGER Echelon® RS-232 Serial Figure 3-3 PTC Enabled GEO Wiring Diagram SIG-00-13-12 February 2021 Version No.: B... -
Page 30: Example Dark Territory Installation
INSTALLATION AND CONFIGURATION _______________________________________________________________________________________________________________ 3.1.2 Example Dark Territory Installation The Drawing below is an example Dark Territory Switch Monitor and Control using a PTC Console with optional I/O connector and PTC communications in a weatherproof pole mount cabinet. PTC RADIO DC-DC 25 Amp DATA... -
Page 31: Figure 3-5 Example Dark Territory Switch Monitor Wiring Diagram
INSTALLATION AND CONFIGURATION _______________________________________________________________________________________________________________ 3.1.2.1 Example Dark Territory Switch Monitor Wiring Diagram The diagram below is an example of a dark territory switch monitor and control for a PTC application. 1SWSB J6-5 1SWSN J6-6 1SWMB J6-3 1SWMN J6-4 1SW CTRL B J6-1 1SW CTRL N J6-2... -
Page 32: Console Installation
INSTALLATION AND CONFIGURATION _______________________________________________________________________________________________________________ CONSOLE INSTALLATION The PTC Console is mounted to the relay rack assembly using the optional mounting bracket. The PTC Console has four #8 threaded mounting holes on the rear of the unit. 3.2.1 Installing Mounting Bracket to Console Use the following procedure to install the optional Mounting Bracket to the PTC Console: 1. -
Page 33: Installing The Ptc Console To The Rack Assembly
INSTALLATION AND CONFIGURATION _______________________________________________________________________________________________________________ 3.2.2 Installing the PTC Console to the Rack Assembly The PTC Console optional Mounting Bracket is designed to mount the console between the relay rack rails. Mount the console using the following procedure: 1. Align the Mounting Bracket with the Relay Rack rails. 2. -
Page 34: Configuration
INSTALLATION AND CONFIGURATION _______________________________________________________________________________________________________________ CONFIGURATION Once installed, the PTC Console will require setup and configuration. Setup and configuration is performed using WebUI and is described in detail in Section 4. Figure 3-8 shows the connection of a laptop computer to the PTC Console using the Laptop port. Figure 3-8 Laptop Connection to the PTC Console SIG-00-13-12 February 2021... -
Page 35: Section 4
WEB USER INTERFACE (WEBUI) _______________________________________________________________________________________________________________ SECTION 4 WEB USER INTERFACE (WebUI) WEB USER INTERFACE (WEBUI) WEBUI OVERVIEW The PTC Console comes with a Web User Interface (WebUI) which enables users to configure the PTC Console locally at the console as well as remotely. Using a standard web browser, enter the IP address assigned to the console (e.g. -
Page 36: Webui Login Page
Upon connecting to the console, the WebUI Login Page will come up. Log into the console using the assigned Password and click on the Login button. Note that Passwords are case sensitive. The factory default password is Siemens. Figure 4-2 WebUI Login Page... -
Page 37: Configuration Menu
WEB USER INTERFACE (WEBUI) _______________________________________________________________________________________________________________ 4.1.2 Configuration Menu The WebUI opens with the Configuration Menu. The Configuration Menu contains three sub-menus for site information: Applications, Non-Vital Configuration, Vital Configuration. Click on any of the menu buttons to bring up the corresponding configuration page. Figure 4-3 Configuration Menu SIG-00-13-12 February 2021... -
Page 38: Figure 4-4 Vital Application Information
WEB USER INTERFACE (WEBUI) _______________________________________________________________________________________________________________ 4.1.2.1 Vital Application The vital application page provides a quick reference location for the MCF, MCF CRC, and UCN applicable to the item selected. This is also where the MCF CRC and UCN are entered. Figure 4-4 Vital Application Information WARNING THE MCF, MCF PARAMETERS SETTINGS AND UCN MUST BE SET... -
Page 39: Figure 4-5 Configuration Menu - Site Information
WEB USER INTERFACE (WEBUI) _______________________________________________________________________________________________________________ 4.1.2.2 Site Information The Site Information menu enables the User to configure Site Name, DOT Number, Mile Post, Time Zone, ATCS Address, Date, Time, and PTC UCN. Figure 4-5 Configuration Menu - Site Information Setting the Time Zone •... -
Page 40: Figure 4-7 Setting The Date
WEB USER INTERFACE (WEBUI) _______________________________________________________________________________________________________________ Setting the Date • To set the Date, click on the calendar icon on the right of the Date box. Highlight the current date and click on it with the mouse. Figure 4-7 Setting the Date SIG-00-13-12 February 2021 Version No.: B... -
Page 41: Figure 4-8 Setting The Time
WEB USER INTERFACE (WEBUI) _______________________________________________________________________________________________________________ Setting the Time • To set the time click on the Hours drop menu and highlight the current hour, click on the Minutes drop menu and select the current minute, and select the Seconds drop menu and select the current second. Click on the Save button to accept changes or the Discard button delete any changes. -
Page 42: Figure 4-10 Ptc General Menu
WEB USER INTERFACE (WEBUI) _______________________________________________________________________________________________________________ PTC - General Menu • The PTC - General menu is shown in Figure 4-10 below. Some parameters may have a key lock or a PTC designator. These parameters affect applicable UCN (Unique Check Number) and PTC UCN. Changing these parameters will place the system in the safe mode and render the console in an unconfigured state. -
Page 43: Figure 4-11 Ptc Emp Menu
WEB USER INTERFACE (WEBUI) _______________________________________________________________________________________________________________ PTC EMP Menu • The PTC - EMP menu is shown in Figure 4-11 below. Refer to AAR specification S-9202 for proper values in setting up the PTC-EMP. Figure 4-11 PTC EMP Menu WARNING THE USER MUST ENSURE THAT EACH SITE IS GIVEN A UNIQUE HMAC KEY. -
Page 44: Figure 4-13 Ptc - Beacon Message Configuration - Beacon Continuous
WEB USER INTERFACE (WEBUI) _______________________________________________________________________________________________________________ PTC - Beacon Message • The PTC Beacon Message configuration with the Beacon Continuous option is shown in Figure 4-13 below. Figure 4-13 PTC - Beacon Message Configuration - Beacon Continuous The PTC Beacon Message configuration with the Beacon Times Out option is shown in Figure 4-14 below. Figure 4-14 PTC - Beacon Message Configuration - Beacon Times Out 4-10 SIG-00-13-12... -
Page 45: Figure 4-15 Ptc - Time Source Configuration
WEB USER INTERFACE (WEBUI) _______________________________________________________________________________________________________________ PTC - Time Source Configuration • Figure 4-15 displays the PTC Time Source configuration option with EMP selected. Figure 4-15 PTC - Time Source Configuration 4-11 SIG-00-13-12 February 2021 Version No.: B... -
Page 46: Figure 4-16 Ptc - Time Source Configuration - Ntp Option Parameters
WEB USER INTERFACE (WEBUI) _______________________________________________________________________________________________________________ PTC - Time Source Configuration - NTP Option • The NTP option will expand the parameters to include the NTP parameters. These parameters are hidden until the NTP option is selected. In the NTP Mode field, if Unicast is selected the PTC Console requests time updates from a specific IP address: Primary NTP Time Source, or if that isn’t available, the Backup NTP Time Source. -
Page 47: Figure 4-18 Preferred Time Source Emp Address Entry
WEB USER INTERFACE (WEBUI) _______________________________________________________________________________________________________________ Up to six time sources can be selected and arranged in the desired priority. If a time source is not available the next available source is used. Should a higher priority source become available the PTC Console will be directed to that source. -
Page 48: Figure 4-20 Ptc - High Availability Setup - Priority
WEB USER INTERFACE (WEBUI) _______________________________________________________________________________________________________________ PTC - High Availability Links • Enabling the High Availability function will open a new screen with link connection setup positions for entry of High Availability Link IP Addresses. The High Availability setup screen is shown in Figure 4-20. The two High Availability Modes are Priority and Round Robin. -
Page 49: Figure 4-22 Console Configuration Menu
WEB USER INTERFACE (WEBUI) _______________________________________________________________________________________________________________ 4.1.2.4 Console Configuration The Console Configuration menu has four sub-menus for Serial Ports, Ethernet Ports, Security, and Web Server as shown in Figure 4-22. Figure 4-22 Console Configuration Menu Console Configuration - Serial Ports • Figure 4-23 displays the serial port configuration menu (left) and one of the four sub-menus for the Laptop port. -
Page 50: Figure 4-24 Serial Port Configuration Options
WEB USER INTERFACE (WEBUI) _______________________________________________________________________________________________________________ Figure 4-24 shows the configurable parameters options for Serial Ports 1-3. Note that many of the protocols are not functional at this time and have been reserved for future applications. The primary protocol for the PTC Console is Genisys GEO used with the serial link to the GEO System with a CPU1. -
Page 51: Figure 4-26 Console Configuration - Ethernet Ports
WEB USER INTERFACE (WEBUI) _______________________________________________________________________________________________________________ Figure 4-26 displays the Ethernet Port configuration screen. Four tabs select the sub-menus. Port 1 through Port 3 are located on the bottom of the console. The DNS tab is used to set the DNS server IP Addresses. Figure 4-26 Console Configuration - Ethernet Ports Port 1-3 Configuration - Disabled •... -
Page 52: Figure 4-27 Ethernet Port Configuration - Dns
WEB USER INTERFACE (WEBUI) _______________________________________________________________________________________________________________ DNS Server Configuration • Three DNS Server IP Address configurations are accessed by selecting the DNS menu as shown in Figure 4-27. Figure 4-27 Ethernet Port Configuration - DNS Console Configuration - Security • The Security sub-menu enables configuration of passwords for the WebUI. A session inactivity timer can be set to close the session if left unattended. -
Page 53: Figure 4-29 Web Server Configuration
WEB USER INTERFACE (WEBUI) _______________________________________________________________________________________________________________ Web Server Configuration • Click on the Web Server text (located below the Security menu) to open the Web Server screen. The Web Server parameter sets the WebUI access security to the PTC Console. Select Secure or Non-Secure (Secure is recommended) and click Save to save the selection. -
Page 54: Figure 4-31 Echelon ® Node Configuration
WEB USER INTERFACE (WEBUI) _______________________________________________________________________________________________________________ 4.1.2.6 External Networking To configure the various external networks, click on the External Networking menu. Five sub-menus will appear, but only, Echelon ® networks and SNMP are supported external networking methods. Echelon Network • ® The Echelon ®... -
Page 55: Figure 4-32 Snmp Network Configuration
WEB USER INTERFACE (WEBUI) _______________________________________________________________________________________________________________ SNMP • Enter each Destination IP and Port for up to four destinations [1]. Verify the information and click on the SAVE button [2a] to save any changes or click on the DISCARD button [2b] to remove any changes. The REFRESH button [3] refreshes the screen and the DEFAULT button [4] changes all entries to the original factory default values. -
Page 56: Figure 4-33 Snmp Setup
WEB USER INTERFACE (WEBUI) _______________________________________________________________________________________________________________ The Alarm Suppression Timer sets the amount of time the console will suppress CDL applications and Alarms when the On-Site Personnel button is pressed on the console front panel by the Maintainer. The timer can be adjusted from 10 minutes to 180 minutes. -
Page 57: Table 4-1 Snmp Information
WEB USER INTERFACE (WEBUI) _______________________________________________________________________________________________________________ SNMP Traps • SNMP messages sent from the PTC Console are received in the Back Office. The CDL program defines which alarms are sent. Table 4-1 SNMP Information SNMP OID VALUE DESCRIPTION Defines the type of equipment that sent the SNMP trap. -
Page 58: Figure 4-34 Log Setup
WEB USER INTERFACE (WEBUI) _______________________________________________________________________________________________________________ 4.1.2.7 Log Setup The Log Setup Menu has three sub-menus for Consolidated Logging, Diagnostic Message Logging Options, and Log Verbosity. Figure 4-34 Log Setup (Consolidated Logging Consolidated Logging • Consolidated Logging enables logs to be consolidated to a single location. A log is still held locally, however, reports will be forwarded to a single location. -
Page 59: Figure 4-35 Diagnostic Message Logging Options
WEB USER INTERFACE (WEBUI) _______________________________________________________________________________________________________________ Diagnostic Message Logging Options • The Diagnostic Message Logging Options screen provides the User the ability to enable or disable thirteen options as shown in Figure 4-35. All options are disabled by default. Each option may be enabled or disabled as desired. -
Page 60: Figure 4-36 Log Verbosity Settings
WEB USER INTERFACE (WEBUI) _______________________________________________________________________________________________________________ Log Verbosity Settings • The Log Verbosity may be set to gather information at various levels. Default is Basic which gathers general information. The Error setting will log only error messages while the Warning setting gathers warnings. The Info setting collects the minimum amount of data. -
Page 61: Figure 4-38 Geo Slot Selection And Geo Log Verbosity/Level
WEB USER INTERFACE (WEBUI) _______________________________________________________________________________________________________________ GEO Log Verbosity - Slot Selection and GEO Log Verbosity/Level • After selecting the desired GEO unit, a new screen will display the drop-down menus for Slot selection and GEO Log Verbosity/Level. Figure 4-38 GEO Slot Selection and GEO Log Verbosity/Level 4.1.2.8 Non-Vital Set to Defaults The final configuration menu is the Non-Vital Set to Default function. -
Page 62: Report And Logs
WEB USER INTERFACE (WEBUI) _______________________________________________________________________________________________________________ 4.1.3 Report and Logs The Reports and Logs menu has five sub-menus: Event Logs, Reports, GEO Configuration Report, GEO Logs, and GEO Software Info, as shown in Figure 4-40. Figure 4-40 Reports and Logs Menus 4.1.3.1 Event Log The Event Log records events based on the configured verbosity. -
Page 63: Figure 4-42 Event Log - Advanced
WEB USER INTERFACE (WEBUI) _______________________________________________________________________________________________________________ Event Log - Advanced • The Advanced search of the Event Log enables the user to search a particular time period in the log, saving searching the entire log for information desired. The same Basic search navigation is included in addition to the Advanced search features as shown in Figure 4-42. -
Page 64: Figure 4-43 Event Log - Trace Events
WEB USER INTERFACE (WEBUI) _______________________________________________________________________________________________________________ Event Log - Trace Events • The Trace Events option enables the User to see events as they come in. Click on the Start button to start tracing events. The screen refreshes every five seconds so events can be viewed in near real time. Click the Stop button to halt tracing events. -
Page 65: Figure 4-44 Create Or Download Configuration Report
WEB USER INTERFACE (WEBUI) _______________________________________________________________________________________________________________ 4.1.3.2 Configuration Report The configuration reports lists all of the parameter settings currently programmed into the system. Click on the Create button to generate the Configuration Report or click on Download to download the report to a computer. Figure 4-44 Create or Download Configuration Report Figure 4-45 shows a completed creation of a Configuration Report. -
Page 66: Figure 4-46 Geo Configuration Report
WEB USER INTERFACE (WEBUI) _______________________________________________________________________________________________________________ 4.1.3.3 GEO Configuration Report The GEO Configuration Report provides software and hardware information for the modules installed in the GEO unit. Figure 4-46 shows an example of the GEO Configuration Report. Figure 4-46 GEO Configuration Report 4-32 SIG-00-13-12 February 2021... -
Page 67: Figure 4-47 Create Or Download Version Report
WEB USER INTERFACE (WEBUI) _______________________________________________________________________________________________________________ 4.1.3.4 Version Report The Version report lists all the hardware and software version information. Click on the "Create" button to generate the Version Report or click on "Download" to download the report to a computer. Figure 4-47 Create or Download Version Report Figure 4-48 shows a completed creation of a Version Report Figure 4-48 Version Report... -
Page 68: Figure 4-49 Diagnostic Log - Basic
WEB USER INTERFACE (WEBUI) _______________________________________________________________________________________________________________ 4.1.3.5 Diagnostic Log The Diagnostic Log records events based on the configured verbosity. There are three retrieval methods available. Diagnostic Log - Basic • The Basic search of the Event Log is shown in Figure 4-49. Buttons are included to navigate to the beginning or the end of the log. -
Page 69: Figure 4-50 Diagnostic Log - Advanced
WEB USER INTERFACE (WEBUI) _______________________________________________________________________________________________________________ Diagnostic Log - Advanced • The Advanced search of the Diagnostic Log enables search a particular time period in the log saving searching the entire log for information desired. The same Basic search navigation is included in addition to the Advanced search features as shown in Figure 4-50. -
Page 70: Figure 4-51 Diagnostic Log - Trace Events
WEB USER INTERFACE (WEBUI) _______________________________________________________________________________________________________________ Diagnostic Log - Trace Events • The Trace Events option enables the User to see events as they come in. Click on the START button to start tracing events. The screen refreshes every five seconds so events can be viewed in near real time. Click the STOP button to halt tracing events. -
Page 71: Figure 4-53 Geo Event Log Navigation
WEB USER INTERFACE (WEBUI) _______________________________________________________________________________________________________________ GEO Event Log Navigation • Navigation for the GEO Event Log has status or summary log selection and a Slot drop-down menu that enables selection of each available slot. Navigation buttons enable selection of the desired portion of the log for viewing. Prints all Selects the Selects the... -
Page 72: Figure 4-55 Software Info List
WEB USER INTERFACE (WEBUI) _______________________________________________________________________________________________________________ An information list will generate with information on the software installed including version, UCN, MCFCRC, Slot location, current verbosity setting depending on the type of software. Click the DOWNLOAD button to save the listing to a computer file. Figure 4-55 Software Info List 4-38 SIG-00-13-12... -
Page 73: Figure 4-56 Download All Logs - Start And End Date/Time
WEB USER INTERFACE (WEBUI) _______________________________________________________________________________________________________________ 4.1.3.8 Download All Logs The Download All Logs menu will download all three logs. The date and time may be selected to define the time frame of the logs. The Date is selected using pop-up calendars on the Start Date and End Date text boxes. The Time is selected using the drop-down boxes for hours, minutes, and seconds for the start time and the end time as shown in Figure 4-56. -
Page 74: Figure 4-57 Viewing And Saving Logs
WEB USER INTERFACE (WEBUI) _______________________________________________________________________________________________________________ Download All Logs - Viewing and Saving • Once the starting and ending date and time has been selected, click on the download button. The download will start and will show progress on the screen. When the download is complete a pop-up window will appear to enable viewing or saving the logs as shown in Figure 4-57 below. -
Page 75: Figure 4-58 Downloading All Reports
WEB USER INTERFACE (WEBUI) _______________________________________________________________________________________________________________ 4.1.3.9 Download All Reports The Download All Reports menu has a single DOWNLOAD button. Click on the button to download all of the reports. When the download is complete, a pop-up will appear for viewing or saving the reports as shown in Figure 4-58. -
Page 76: Figure 4-59 Selecting Cdl
WEB USER INTERFACE (WEBUI) _______________________________________________________________________________________________________________ 4.1.3.10 CDL (Control Description Language) Files To access CDL Menu, select Applications icon from menu bar, then, under Applications column, select CDL. The CDL Menu enables uploading and running CDL applications. To upload a CDL file, click on the Upload CDL button. -
Page 77: Figure 4-61 Running Cdl Files - Sequence File
WEB USER INTERFACE (WEBUI) _______________________________________________________________________________________________________________ Select the answer to the next question (in this case Yes or No) Select Test Condition Figure 4-61 Running CDL Files - Sequence File Continue to click the NEXT button to continue until the end of the sequence is reached. All tests should have a green check if the test was successful. -
Page 78: Figure 4-63 Compile Cdl File
WEB USER INTERFACE (WEBUI) _______________________________________________________________________________________________________________ The final step is to compile the CDL file. Click the Next button [1] as shown below. Figure 4-63 Compile CDL File A pop up window will appear asking to the user if they want to compile the CDL file. Click on the OK button to continue as shown in the figure below. -
Page 79: Figure 4-65 Verification Of Successful Cdl Compilation
WEB USER INTERFACE (WEBUI) _______________________________________________________________________________________________________________ A confirmation text will appear to confirm the compilation was successful. Figure 4-65 Verification of Successful CDL Compilation View or Download CDL Log • The CDL Log displays the compiling of the CDL file (both successful and failed files). To view the CDL Log, click on the View CDL Log button. -
Page 80: Figure 4-67 Cdl Log Printout
WEB USER INTERFACE (WEBUI) _______________________________________________________________________________________________________________ CDL Log Printout • The CDL Log will appear in the window for local viewing as shown in Figure 4-67. Figure 4-67 CDL Log Printout 4-46 SIG-00-13-12 February 2021 Version No.: B... -
Page 81: Figure 4-68 Removing A Cdl File
WEB USER INTERFACE (WEBUI) _______________________________________________________________________________________________________________ Removing a CDL File • To remove a CDL file from the PTC Console, click on the Remove CDL button as shown in Figure 4-68. A confirmation message will appear confirming the CDL has been removed as shown in Figure 4-69. Figure 4-68 Removing a CDL File Figure 4-69 CDL File Removal Confirmation 4-47... -
Page 82: Status Monitor
WEB USER INTERFACE (WEBUI) _______________________________________________________________________________________________________________ 4.1.4 Status Monitor The Status Monitor has nine sub-menus for monitoring status, PTC Status, High Availability, System State View, Echelon Statistics, Ethernet Status, Online Status, GEO IO Module, ATCS Comm, and UI Sessions.. Figure 4-70 Status Monitor Menus 4.1.4.1 Status Monitor - PTC Status The PTC Status function in the Status Monitor menu displays real-time Signal and Switch information being sent... -
Page 83: Figure 4-72 Status Monitor - System State View
WEB USER INTERFACE (WEBUI) _______________________________________________________________________________________________________________ 4.1.4.2 Status Monitor - System State View Figure 4-72 displays the System State View which displays information for the PTC Console and connected devices. In this example two GEO units and the PTC Console is available. Select the STATUS MONITOR icon to open the sub-menus. -
Page 84: Figure 4-74 System State View - View Connections
WEB USER INTERFACE (WEBUI) _______________________________________________________________________________________________________________ Status Monitor - System State View - View Connections • Figure 4-74 displays GEO Objects in the left column. Objects can be expanded [1] and selected. Click on the GET button [2] to retrieve the data available. Figure 4-74 System State View - View Connections Select the desired variable Name and Value and click the SELECT icon. -
Page 85: Figure 4-76 First And Last Logic States
WEB USER INTERFACE (WEBUI) _______________________________________________________________________________________________________________ The Select Range screen will appear with edit text boxes for First Logic State and Late Logic State. Enter the first and last logic states in the range to be displayed (value in the Last Logic State box must be equal to or less than the total number of variables assigned to the object category). -
Page 86: Figure 4-78 System State View - Geo Inputs
WEB USER INTERFACE (WEBUI) _______________________________________________________________________________________________________________ System State View - Inputs • The Input category includes all controls and physical inputs associated with each Geographic Object including relay inputs, searchlight signal mechanism inputs, and coded track inputs. In this example the state of controls and physical inputs of signal ESIG are displayed. -
Page 87: Figure 4-80 System State Views - State Models
WEB USER INTERFACE (WEBUI) _______________________________________________________________________________________________________________ System State View - State Models • The State Models category includes the current state of all state models defined in the Geographic Object Library. In this example the current state of the State Models of signal ESIG are displayed. Signal ESIG is clear;... -
Page 88: Figure 4-82 System State Views - Configuration Parameters
WEB USER INTERFACE (WEBUI) _______________________________________________________________________________________________________________ System State Views - Configuration Parameters • The Configuration Parameters category includes a list of parameters and the current configuration of each parameter. List of Configuration Parameters Current configuration of parameters Figure 4-82 System State Views - Configuration Parameters •... -
Page 89: Figure 4-84 Example System State View - Aspect Information
WEB USER INTERFACE (WEBUI) _______________________________________________________________________________________________________________ Figure 4-84 displays an example of a download printout of Aspect Signal information. SATUsed|True ASPECT_01|Clear ASPECT_02|Approach Diverging ASPECT_03|Advance Approach ASPECT_04|Approach Restricted ASPECT_05|Approach ASPECT_06|Approach ASPECT_07|Diverging Clear ASPECT_08|Diverging Approach Restricted ASPECT_09|Diverging Approach ASPECT_10|Restricting ASPECT_11|Stop ASPECT_12|Stop ASPECT_13|Stop ASPECT_14|Invalid ASPECT_15|Invalid ASPECT_16|Invalid ASPECT_17|Invalid... -
Page 90: Figure 4-86 Status Monitor - Ethernet Status
WEB USER INTERFACE (WEBUI) _______________________________________________________________________________________________________________ 4.1.4.4 Ethernet Status The Ethernet Status screen shows the four Ethernet ports and their current settings and connection status. Figure 4-86 Status Monitor - Ethernet Status 4-56 SIG-00-13-12 February 2021 Version No.: B... -
Page 91: Figure 4-87 Status Monitor - Online Status
WEB USER INTERFACE (WEBUI) _______________________________________________________________________________________________________________ 4.1.4.5 Online Status The Online Status lists in real time the status of the components of the selected device. The Online Status comes up running and collecting data. To stop the Online Status stream click on the Stop button. To restart the Online Status stream click on the Start button. -
Page 92: Figure 4-88 Status Monitor - Geo I/O Module Display
WEB USER INTERFACE (WEBUI) _______________________________________________________________________________________________________________ 4.1.4.6 Status Monitor - GEO I/O Module The GEO I/O Module screen shows a graphic display of the GEO modules of the selected unit. The display is near real time with a snapshot refreshed every few seconds. Indicates Update in Progress when not used. -
Page 93: Figure 4-90 Coded Track
WEB USER INTERFACE (WEBUI) _______________________________________________________________________________________________________________ GEO I/O Module Displays • The following are detailed views of the individual modules displayed on the GEO I/O Module real-time screen. Module label: GREEN: when module is operational RED: when un-configured or VLP CP are not communicating External battery voltage +5VDC on Module Air Temp near CPU... -
Page 94: Figure 4-91 Colorlight
WEB USER INTERFACE (WEBUI) _______________________________________________________________________________________________________________ Lamp mnemonic Lamp Status: OFF, ON, FLASH or LOR Lamp Status: BLACK when off GREEN, YELLOW, RED, or LUNAR when on YELLOW background when foreign energy detected Output mnemonic Output Status: OFF, ON, FLASH or specific cab rate Output Status: GREEN when on, BLACK when off... -
Page 95: Figure 4-93 Geo I/O - Geo Module Information
WEB USER INTERFACE (WEBUI) _______________________________________________________________________________________________________________ GEO I/O - Module Information • GEO Module information may be retrieved by RIGHT CLICKING the mouse on the Module Label. A pop-up menu will appear, select MODULE INFORMATION and click the mouse. A pop-up window will appear displaying the module parameters and that parameter's value. -
Page 96: Figure 4-94 Geo I/O - Geo Module Reset
WEB USER INTERFACE (WEBUI) _______________________________________________________________________________________________________________ GEO I/O - Module Reset • A GEO module can be reset by right clicking the mouse on the Module Label. A pop-up menu will appear, select Module Reset and click the mouse. A pop-up window will appear displaying the module is being rebooted. WARNING SITE EQUIPMENT MUST BE PLACED IN THE MAINTENANCE MODE AND APPLICABLE SAFETY PRECAUTIONS IN PLACE TO PROTECT... -
Page 97: Figure 4-95 Atcs Communications Links
WEB USER INTERFACE (WEBUI) _______________________________________________________________________________________________________________ 4.1.4.7 Status Monitor - ATCS Comm The ATCS Communication Links (ATCS Comm) function displays the ATCS links between the GEO and connected devices. Figure 4-95 details the ATCS Comm display. Link Label: GREEN when communication session is established. -
Page 98: Figure 4-96 Atcs Comm Link - Message Field Status
WEB USER INTERFACE (WEBUI) _______________________________________________________________________________________________________________ ATCS Communication Link - Message Field Status • When navigating the cursor over the message fields the state of the field will appear, 1 = Set (Green field) and 0 = Clear (Red field) as shown below: Figure 4-96 ATCS Comm Link - Message Field Status 4.1.4.8 UI Sessions... -
Page 99: Maintenance
WEB USER INTERFACE (WEBUI) _______________________________________________________________________________________________________________ 4.1.4.9 High Availability The High Availability status displays the communication links available. If a link fails the PTC Console will configure the next link available prioritizing the connection by its availability. If a link becomes available with a higher priority the PTC Console will reconfigure to that link. -
Page 100: Figure 4-100 Unlocking Ptc Console
WEB USER INTERFACE (WEBUI) _______________________________________________________________________________________________________________ 4.1.5.1 Maintenance - Software Update When performing a software update using WebUI from a location outside of the equipment site it is necessary for an authorized technician be present at the site. The technician will need to approve access to the console before the outside source can perform any uploading functions. -
Page 101: Figure 4-101 Unlocking Ptc Console - Authenticated
WEB USER INTERFACE (WEBUI) _______________________________________________________________________________________________________________ When the on-site technician approves the remote access to the console, an authentication message will appear on the WebUI screen. The software update can now be performed. Figure 4-101 Unlocking PTC Console - Authenticated Software Update Options •... -
Page 102: Figure 4-103 Non-Vital Executive Software Update
WEB USER INTERFACE (WEBUI) _______________________________________________________________________________________________________________ Software Update - Sub-Menu Screens • The following figures display the nine software update sub-menu screens. Figure 4-103 Non-Vital Executive Software Update Figure 4-104 GEO Software Update Figure 4-105 Vital Core Software Update 4-68 SIG-00-13-12 February 2021 Version No.: B... -
Page 103: Figure 4-106 Geo Cartridge Software Update
WEB USER INTERFACE (WEBUI) _______________________________________________________________________________________________________________ Figure 4-106 GEO Cartridge Software Update Figure 4-107 Non-Vital Configuration Software Update Figure 4-108 Non-Vital Application Software Upgrade Figure 4-109 Vital Configuration Software Upgrade 4-69 SIG-00-13-12 February 2021 Version No.: B... -
Page 104: Figure 4-110 Rc2 Key Software Upgrade
WEB USER INTERFACE (WEBUI) _______________________________________________________________________________________________________________ Figure 4-110 RC2 Key Software Upgrade Figure 4-111 Site Configuration Software Upgrade Download From System • The following screens display the sub-menus for downloading Vital and Non-Vital Configuration and Application files from the PTC Console. Figure 4-112 Download Configuration and Application Files 4-70 SIG-00-13-12... -
Page 105: Figure 4-113 Vital Configuration Download
WEB USER INTERFACE (WEBUI) _______________________________________________________________________________________________________________ Figure 4-113 Vital Configuration Download Figure 4-114 Vital Application Download Figure 4-115 Non-Vital Configuration Download Figure 4-116 Non-Vital Application 4-71 SIG-00-13-12 February 2021 Version No.: B... -
Page 106: Diagnostics
WEB USER INTERFACE (WEBUI) _______________________________________________________________________________________________________________ PTC Class D Tests • PTC Class D Tests verify the IP based point to point protocol for messaging. Test message can be enabled and sent to a test server. The test results are logged for review later. Set All Refresh Save... -
Page 107: Figure 4-119 Geo Statistics
WEB USER INTERFACE (WEBUI) _______________________________________________________________________________________________________________ 4.1.6.1 GEO Statistics The GEO Statistics diagnostics menu has eight statistics screens as shown in Figure 4-119. Figure 4-119 GEO Statistics GEO Statistics Screens • The following are the GEO Statistics screens available. Card Clear Number Number Of Number Of... -
Page 108: Figure 4-121 Atcs Statistics
WEB USER INTERFACE (WEBUI) _______________________________________________________________________________________________________________ Card Number Clear Refresh Number Of Number Of Number Of Slot Of Bad Info Lost Lost Lost Number CRC'S Screen Screen Sessions Sessions Sessions Figure 4-121 ATCS Statistics Clear Screen Refresh Screen Card Number Number Of Number Of Number Of Number Of... -
Page 109: Figure 4-123 Time Statistics
WEB USER INTERFACE (WEBUI) _______________________________________________________________________________________________________________ Card Number Number Of Clear Refresh Slot Of Bad Info Lost Number CRC'S Sessions Screen Screen Figure 4-123 Time Statistics Message activity between Number of transmissions Clear Refresh GEO CPU and Cards (65535 is maximum number therefore count is higher) Screen Screen... -
Page 110: Figure 4-125 Console Statistics
WEB USER INTERFACE (WEBUI) _______________________________________________________________________________________________________________ Clear Number of transmission packets Refresh Number of transmissions sent by the PTC Console (65535 is maximum number Screen Screen therefore count is higher) Figure 4-125 Console Statistics Clear Refresh Number of transmission packets Number of transmissions sent by the LAN (65535 is maximum number Screen... -
Page 111: Figure 4-128 Information Alert Icon And Data Display
WEB USER INTERFACE (WEBUI) _______________________________________________________________________________________________________________ 4.1.6.2 Information The Information window serves as an alert vehicle to advise the user of a situation present within the system. Monitor and Diagnostic windows will display an information icon in the upper right corner of the page as shown in Figure 4-128. -
Page 112: Figure 4-129 Status Monitor - Cdl Status
WEB USER INTERFACE (WEBUI) _______________________________________________________________________________________________________________ 4.1.6.3 CDL Status Figure 4-129 displays the CDL Status screen. If a CDL program is installed and is running a Green "C" will appear in the upper right corner. If a CDL program is installed and not running a Red "C" will appear in the upper right corner. -
Page 113: Figure 4-130 Cdl Event Logs
WEB USER INTERFACE (WEBUI) _______________________________________________________________________________________________________________ CDL Status - CDL Logs • The CDL Status screen also has the CDL Event Log displayed on the lower portion of the screen. The events may be searched by Equipment, Site Name, Card Slot, Event Type and Event Text. A Search Window provides a means of searching events using keywords. - Page 114 WEB USER INTERFACE (WEBUI) _______________________________________________________________________________________________________________ This Page Intentionally Left Blank 4-80 SIG-00-13-12 February 2021 Version No.: B...
-
Page 115: Section 5
There is no maintenance required on the PTC console. Standard housekeeping is recommended to keep dirt and debris from accumulating around the console. There are no user serviceable parts within the console. Failed units should be returned to Siemens for repair or replacement. NOTE If the PTC Console fails, replace the PTC Console but leave the ECD/Power connector installed. -
Page 116: Remote User Access Authentication
MAINTENANCE _______________________________________________________________________________________________________________ Time can be extended by pressing the On-Site Personnel button again. The suppression timer will reset and start the countdown with the full amount of time programed into the console. LED ON Figure 5-1 On-Site Personnel Activation 5.2.2 Remote User Access Authentication When a remote user desires to unlock the PTC Console, a request is sent using WebUI (see Section 4.1.6.1). -
Page 117: Figure 5-3 On-Site Personnel - Alarm Suppression Timer
MAINTENANCE _______________________________________________________________________________________________________________ 5.2.2.1 On-Site Personnel Timer - Alarm Suppression Timer When the On-Site Personnel button is pressed, the Alarm Suppression timer will begin counting down. The Alarm Suppression Timer is user adjustable from 10 to 180 minutes. Default value is 20 minutes. When the timer times out, the CDL functions will activate and alarms will be sent to their designated destination. - Page 118 MAINTENANCE _______________________________________________________________________________________________________________ This Page Intentionally Left Blank SIG-00-13-12 February 2021 Version No.: B...
-
Page 119: Appendix Asystem Management Command Reference
SYSTEM MANAGEMENT _______________________________________________________________________________________________________________ APPENDIX A SYSTEM MANAGEMENT COMMAND REFERENCE SERIAL TERMINAL INTERFACE Open the desired terminal interface tool and select File > New Connection. In the TCP/IP Address field, type the IP address of the PTC Console unit, then select OK. Figure 5-4 Enter IP Address The terminal interface may then display a security warning, select Continue to move past this screen. -
Page 120: Figure 5-6 Login Screen
SYSTEM MANAGEMENT _______________________________________________________________________________________________________________ The terminal interface will then display a login screen, the default username is root and the default password is ptcuser. These can be changed after login using the standard Linux commands. Figure 5-6 Login Screen COMMANDS Each systems management command is described in the following sections. The command names and parameters are case-sensitive unless specified otherwise. -
Page 121
SYSTEM MANAGEMENT _______________________________________________________________________________________________________________ GET_DAIG, GET_EVENTS get_diag [-t
] Print the last worth of diagnostic log entries. Figure 5-7 Get_Diag Example get_diag [-s - Page 122 SYSTEM MANAGEMENT _______________________________________________________________________________________________________________ A.3.2. Examples The following shows requesting the last 24 hours from the diagnostic log: # get_diag –t 24 The following shows requesting between 15:30 and 18:00 today from the event log: # get_events –s 15:30:00 –e 18:00:00 The following shows requesting from the beginning of the log to a certain date (at midnight).
- Page 123 DOT number (unused), milepost, and ATCS address for the product. Siemens Mobility, Inc. manufacturing use the who command to set the model, revision, and serial number data. [FUTURE, not yet implemented] This command will also show the software and hardware revision information for the connected GEO systems.
-
Page 124
SYSTEM MANAGEMENT _______________________________________________________________________________________________________________ A.5.2. Examples The following example shows viewing the information provided by the command. # who iVIU Site: CP 360 DOT is: Mile post: 122.2 ATCS Address: 7.620.100.100.02 iVIU Model: PTC Console iVIU Revision: B6 iVIU Serial #: 172 WIUCONF wiuconf –g
... - Page 125 SYSTEM MANAGEMENT _______________________________________________________________________________________________________________ The wiuconf utility will parse the given file and apply the contents of the file to the unit’s non-vital configuration settings. The non-vital configuration file can also contain CDL-defined menu or operational parameters. If necessary, this may result in a re-compile of the CDL logic loaded in the unit. The command will report any errors parsing the file or compilation errors.
- Page 126 SYSTEM MANAGEMENT _______________________________________________________________________________________________________________ A.6.2. Examples The following will generate the complete text file of the configuration settings supported by the WIU. The text file can be used as a reference for what variables are supported. # wiuconf –g /tmp/wiu_conf.txt The following is an example to view the PTC UCN (PTC Configuration CRC). # wiuconf -d ptc_ucn 5e5ab213 The following is an example to set the encrypted HMAC key:...
- Page 127 SYSTEM MANAGEMENT _______________________________________________________________________________________________________________ Laptop_Eth_Port:DHCP Laptop_Eth_Port:IP_Address Laptop_Eth_Port:NetMask Laptop_Eth_Port:Gateway Eth_Port1:DHCP Eth_Port1:IP_Address Eth_Port1:NetMask Eth_Port1:Gateway Eth_Port2:DHCP Eth_Port2:IP_Address Eth_Port2:NetMask Eth_Port2:Gateway Eth_Port3:DHCP Eth_Port3:IP_Address Eth_Port3:NetMask Eth_Port3:Gateway Module1:Name Module1:Type Module1:GEO:Connection_Type Module1:GEO:ATCS_Subnode Module1:GEO:UCN Module1:GEO:MCF_CRC Module2:Name Module2:Type Module2:GEO:Connection_Type Module2:GEO:ATCS_Subnode Module2:GEO:UCN Module2:GEO:MCF_CRC (etc. up to Module16) SIG-00-13-12 February 2021 Version No.: B...
- Page 128 SYSTEM MANAGEMENT _______________________________________________________________________________________________________________ This Page Intentionally Left Blank A-10 SIG-00-13-12 February 2021 Version No.: B...